
What's the Relationship Between Data Intelligence & RFID Technology?
As technology advances each year, new trends emerge like the Metaverse and Generative AI that allow companies to grow in ways we never could have imagined. While some trends such as Generative AI haven’t quite matured to their full capacity, limiting their usage in certain verticals, other trends like the rise in data intelligence can be implemented now.
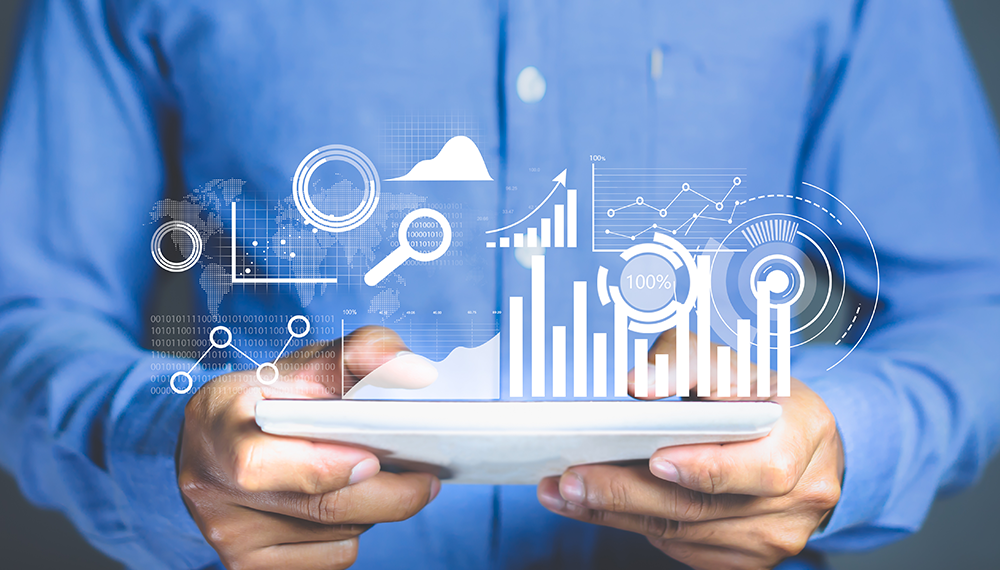
What is Data Intelligence? According to hpe.com [Hewlett Packard Enterprise], Data intelligence refers to the tools and methods that enterprise-scale organizations use to better understand the information they collect, store, and utilize to improve their products and/or services. Apply AI and machine learning to stored data, and you get data intelligence.
Data Intelligence, or Data Science, is one of the fastest growing technologies right now because industries are starting to shift from the mindset of collecting as much data as possible to collecting the right data and making actionable, data-driven decisions. That’s not to say that previously companies have not been using data; obviously, data-driven decisions are made by companies every day, but how much of the data that a business collects does it actually use? According to Zippia.com, in 2023 the average company only analyzes 37-40% of the data they collect.
Some companies recognized this switch from data collecting to data science in 2020 and 2021 and hired data scientists, data engineers, and data analysts, whose sole purpose is to sift through the massive amounts of data sitting on terabytes of cloud server storage and to determine what data is actionable and important.
So, you might be asking:
“How do RFID technology and IoT fit into data intelligence?”
The answer is:
Just like any other data collection system.
The sole purpose of an RFID reader is to read and provide RFID tag data. There must be a certain level of data intelligence applied for end users to understand what each RFID tag read represents. Companies can then make the most of the data by collecting only the data they need and using it to drive business in new and intelligent ways.
Data Collection with RFID
The sheer amount of data that an RFID reader can spit out can be daunting. Not to mention the fact that the raw data without applied intelligence is typically just a string of 24 characters that usually means nothing on its own.
I like the license plate analogy.
License plate numbers mean nothing unless you are in a state’s license plate database with all the associated data.
Associating a tag’s EPC or TID number with meaningful information like a product’s name, SKU, and/or color makes that tag read more valuable, and for a lot of companies that’s the end of the road in terms of data intelligence.
But it can be so much more.
For the purpose of this article, I have created 5 levels of business intelligence that a company can create with RFID hardware and software:
- Level 1: Giving Data an Identity
- Level 2: Adding Environmental Relevance
- Level 3: Adding Meaning to Data
- Level 4: Identifying Trends & Patterns
- Level 5: Providing Actionable Data
Level 1: Giving Data an Identity
As I discussed above, the first step when tagging items with RFID tags is to associate the EPC or TID number with meaningful data. Below are a few examples of data that is associated with a specific EPC or TID number.
- Product SKU (RFID in Retail)
- Person’s Name (Race Timing)
- Asset Name (IT Asset Tracking)
- Prescription Number / Drug Name (Pharmaceutical Tracking)
- Machinery Component Information (Preventative Maintenance)
Associating a tag’s EPC number or TID number with meaningful data is done through software, which can be as simple as TSL’s RFID Explorer app, or as complex as a custom software solution.
Without Data Intelligence: Tag Read: 849374859485712908635409
With Data Intelligence: Tag Read: Pallet: 0985; Customer: Amazon; Order Number: 92048

Level 2: Adding Environmental Relevance
Reading an RFID tag and understanding what it represents (i.e., a pallet of goods) is great, but it’s even better when the read is given context. The next logical step to provide meaningful data is adding environmental context like where the read occurred. For example, read at dock doors, read in warehouse 1, or read on storeroom floor. This is typically done by assigning RFID readers and/or antennas a zone and naming the zone what your company sees fit.
Now instead of this (Level 1 Data Intelligence):
Tag Read: Pallet: 0985; Customer: Amazon; Order Number: 92048
Your company has this (Level 1 & 2 Data Intelligence):
Tag Read: Pallet: 0985; Customer: Amazon; Order Number: 92048
Read at Dock Door 2
Adding environmental relevance can be taken one step further by adding directionality. Some companies have RFID hardware set up at precise locations so that the tag is read at one antenna before the other and uses logic to determine the tag’s direction of movement. When antenna 1 reads the RFID tagged object before antenna 2, software can tell the company that the pallet is leaving the warehouse or vice versa if antenna 2 reads the RFID tag first.
Whether adding location or directionality relevance to read data, both factors depend on having specific, fixed locations for the RFID hardware and software capable of handling and providing this data.
In terms of software, Geoffrey Rodgers from Avancir talks a little about how software handles this environmental data.
“While RFID technology offers tremendous capability for understanding the presence, location, and movement of physical items, only software can efficiently combine the raw RFID read data with other information that typically represents value for a business.
Because RFID readers can produce a large amount of data in a very short amount of time, the first task of any software system after collecting the data is filtering or reducing the data down to meaningful events. For example, a RFID can read and report a tag’s presence dozens or hundreds of times in a matter of seconds, so it’s not necessarily important to receive or react to all those tag reads. Instead, software can help indicate, for example, the first time a tag is detected, when a tag is detected at a specified signal strength, or even when a tag is no longer being detected at all.
Once the larger set of raw tag reads is distilled to a prescribed tag read event, the software can then look for a corresponding record in a database where the tag’s EPC or TID has previously been recorded and associated. At this point, the software can append the business data record to the raw RFID tag for further processing.”

Level 3: Adding Meaning to Data
This level of data intelligence is about adding meaning to a read at a specific location. One example of this from the application above is to tell the software that if a pallet is read at a dock door, that means that the order is getting ready to ship. Adding this level of meaning or intelligence provides insight into a specific company’s processes and basically adds a label or status to a location read.
Some examples include:
- Retail Inventory Management – A tag read in a certain location could mean the item is in inventory and available for purchase.
- Attendee Tracking – A tag read could mean an attendee visited Company X’s Booth.
- Clothing Rental Service – A tag read could mean a specific dress or handbag is back in inventory or on its way to be laundered.
In some applications, both reading a tag in a specific location AND not reading a tag in a specific location could be important data points. This is especially the case in applications like RFID retail inventory management. If specific RFID tags are not read, it indicates that the item is no longer in stock, which is equally as important as knowing the item is in stock.
Adding this type of meaning is always done in your RFID application’s software. Geoffrey tells us a little about how the software can use these data labels, or statuses, to provide a company meaningful information.
“Applying a status or location to a business data record based on an RFID tag read is an example of an automation, or logic that is used to automatically update attributes of a data record. Automations can be very helpful, especially since company reports are often based on status or location metrics. For example, knowing how many items are in inventory versus how many have been consumed for assembly is based on record statuses while knowing how many items are in the stockroom versus how many items are on the showroom floor is based on record locations.”
Level 4: Identifying Trends & Patterns
Levels 4 and 5 are closely related, but it’s important to separate them because of the additional step in logic.
The next level of business intelligence is all about data science and logic. It’s about taking the now meaningful data and identifying trends and patterns about your products and/or customers. These patterns are based off product/customer history and the logic ‘automations’ are kept in a software’s backend.
The data can then be viewed as a trend report or analysis for business strategists or customer account managers. Some examples include:
- Manufacturing Application: Company X orders on average every 60 days.
- Retail Application: Product 04857: Stretchy High-Rise Leggings, 26” have been out-of-stock 10% more than last month.
- Tool Inventory Management: Crescent Wrench #78 has left the trailer 90 times this month, 10 times more than any other tool.
These insights can be crucial for business intelligence – and provide data that allows companies to make actionable business decisions.

Level 5: Providing Actionable Data
Data intelligence at level 5 is easy to understand but difficult to implement because it relies on logic and data models in the company’s software. With a skilled software engineer or an integrated AI system, actionable data can be implemented in several different ways. Before discussing the implementation and resulting visualization, below are a few examples of actionable data.
- Manufacturing Application: Company X’s orders have increased by 6% each month. Purchase more of product A, product B, and product C to anticipate and meet demand.
- Retail Application: To avoid an out-of-stock, purchase 200 Stretchy High-Rise Leggings, 26” instead of the normal quantity (100).
- Tool Inventory Management: Crescent Wrench #78 might need to be replaced next year due to wear.
Implementing actionable insights through AI, an in-house software development team, or a custom software solution is doable with company data and intimate product, application, company, or even environmental knowledge. Some RFID applications like retail, for instance, will have similar insights like inventory management level decisions, but each company will likely have different triggers like the specific inventory level at which to provide the insight. These triggers can be based on a company’s historical data or, with the implementation of AI, predicted future data.
"Because each company has different processes, measurements, and decision triggers from the next, Avancir was built to be easily customized and extended while still delivering on the value presented by leveraging RFID and similar technologies. It’s important to select software that does not restrict change and growth in an organization because changes will occur as the organization starts to operate more efficiently over time."
Conclusion
For more information on how RFID is used – contact us via phone, email, or our live chat feature!
Added thanks to Geoffrey Rodgers from Avancir for giving us insight into the software angle of RFID's relationship with data intelligence.
Sources:
https://www.linkedin.com/pulse/shift-towards-data...
https://www.forbes.com/sites/adrianbridgwater/202...
https://sloanreview.mit.edu/article/five-key-tren...
https://www.zdnet.com/article/enterprises-are-col...
https://www.businessnewsdaily.com/10625-businesse...